Capacity Building
Understand
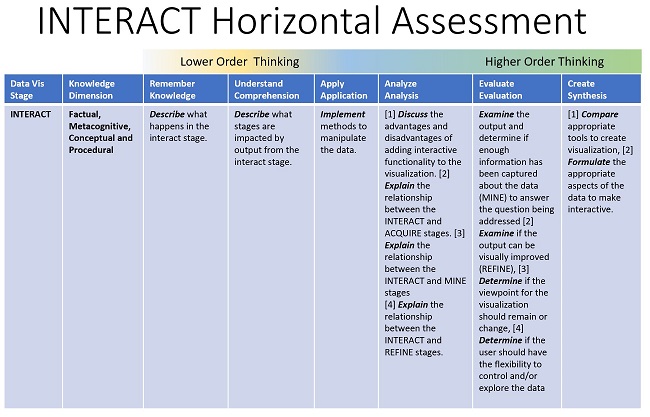
- What what happens in the interact stage.
- Describe what stages are impacted by output from the interact stage.
- Identify what methods are used to manipulate the data.
- Understand the advantages and disadvantages of adding interactive functionality to the visualization.
- Understand the relationship between the INTERACT and ACQUIRE stages.
- Understand the relationship between the INTERACT and MINE stages
- Understand the relationship between the INTERACT and REFINE stages.