Data Visualization Process
Definitions
-
Factual knowledge are the basic ideas students must know to be acquainted.
with data visualization in order to solve data visualization challenges. -
Conceptual knowledge is the understanding of interrelationships that exist between.
the stages within the larger structure of the process that enable the stages to function together. -
Procedural knowledge is the knowledge of techniques and methods and the ability to apply.
them in each stage of the process. -
Metacognitive knowledge is the understanding in general as well as awareness and knowledge of one’s own level of cognition of a topic.
Factual & Conceptual Knowledge Outcomes
-
Students will be able to demonstrate their factual and
conceptual knowledge about the data visualization process:
- The basic stages for visualizing data.
- What happens in each stage of the visualization process.
- What stages are likely to initiate the iterative nature of the process.
- Different techniques used to better understand data.
Procedural Knowledge Outcomes
-
Students will be able to demonstrate their procedural knowledge about the data visualization process:
- Demonstrate actions to acquire data.
- Demonstrate the ability to change raw data into a useful format for further processing.
- Implement procedure(s) to extract data of interest from a larger dataset.
- Choose the appropriate visualization chart for the task/data.
- Implement methods and techniques to improve the visualization.
- Apply best practices for data visualization.
Byrd, V. L. (2021, July). Innovative Pedagogy for Teaching and Learning Data Visualization. In 2021 ASEE Virtual Annual Conference Content Access.
Metacognitive Knowledge Outcomes
-
Students will be able to demonstrate their metacognitive knowledge about the data visualization process:
- Describe, in their own words, what happens in each stage of the data visualization process.
- Describe, in their own words, the iterative nature of the data visualization process.
Resources
Use the following external links for additional resources.
Learning Objectives
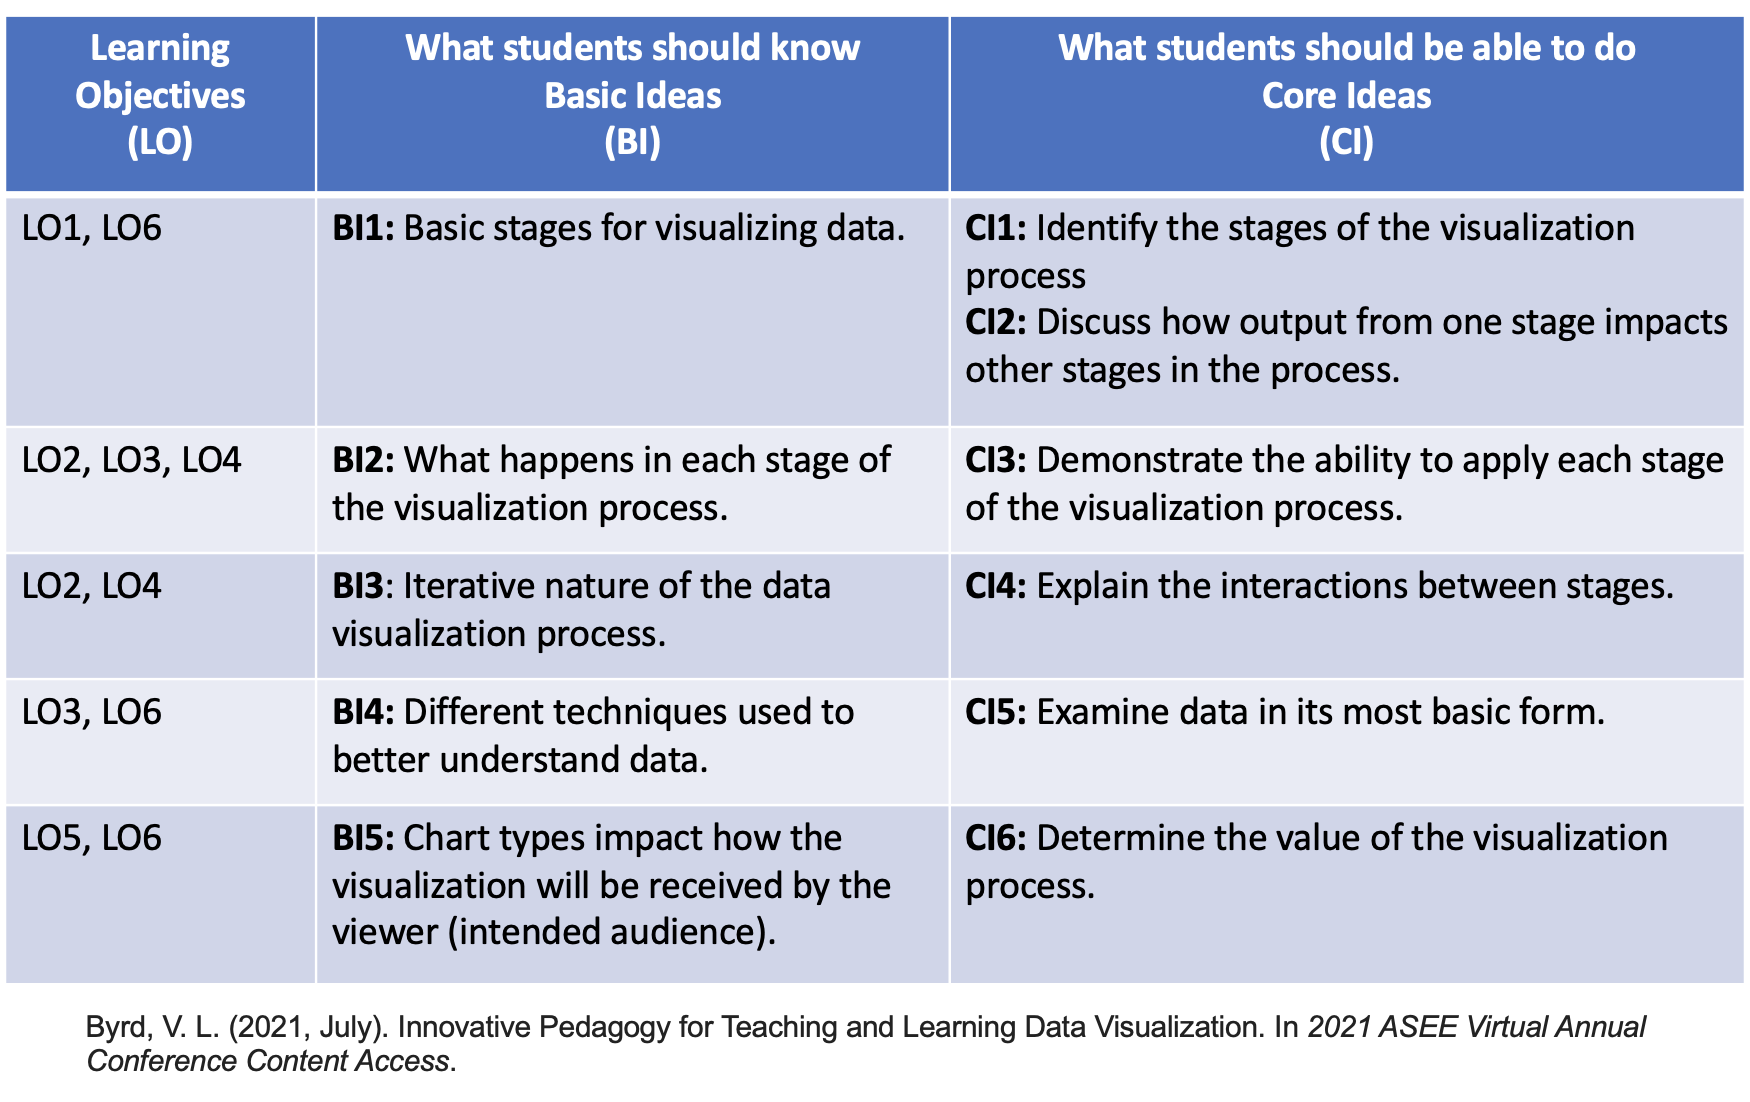
- LO1: Remember and define the stages of visualizing data.
- LO2: Explain the interactions between the stages of the data visualization process.
- LO3: Demonstrate what happens in each stage of the data visualization process.
- LO4: Discuss the interactive nature of the data visualization process.
- LO5: Generate/produce data visualization that provide insight.
- LO6: Self and peer-critique the data visualization process.
Learning Objectives, Basic Ideas, Core Ideas

Self Assessment
Complete this assessment to demonstrate your current knowledge of the Data Visualization Process:
Prerequisites: Make sure to finish the following tasks before working on this assessment.
Evaluation Matrix
Review
Holistic Data Visualization Capacity Rubric
| Score | Description (Consistently does all or most of the following) |
|---|---|
| 4 |
|
| 3 |
|
| 2 |
|
| 1 |
|
What you should know:
- → The stages of visualizing data
- → The interactions between stages
- → The application of each stage
- → How output from one stage impacts other stages in the process
- → The value and purpose of the visualization process
- → The iterative nature of the data visualization process
Data Visualization Process
What you should be able to do:
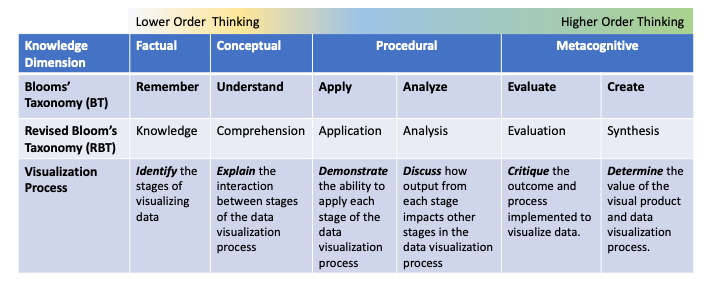
| Focus | You should be able to do |
|---|---|
| Identify | The stages of visualizing data |
| Explain | The interaction between stages of the data visualization process |
| Demonstrate | The ability to apply each stage of the data visualization process. |
| Discuss | How output from each stage impacts other stages in the data visualization process |
| Critique | The outcome and process implemented to visualize data. |
| Determine | The value of the visual product and data visualization process. |
Data Visualization Process Horizontal Assessment
